
Test matches are played between the national representative teams, and this format of cricket is named TEST because it tests the players mentally and physically. A TEST match consists of two innings per team, and an innings is concluded only if the batting team is all out or the team captain declares to close the innings. The TEST format in cricket is the best format for cricket. It brings the batters’ batting performance and the bowlers' bowling performance. Because here only the best batsman survives and bowlers win the match for their team. Let us see the top 10 winning percentages of teams in TEST.
1. Australia with 47.38%
From 1877 to 2022, Australia played 842 matches, won 339, and lost 226, in which 2 were tied and 215 were drawn matches. The win/loss ratio is 1.76, the percentage of winning matches is 47.38%, the percentage of losing matches is 26.84%, and the percentage of matches drawn is 25.53%.

2. South Africa with 38.49%
From 1889 to 2022, South Africa played 452 matches, won 174, and lost 154, in which 0 were tied, and 124 were drawn matches. The win/loss ratio is 1.12, the percentage of winning matches is 38.49%, the percentage of losing matches is 34.07%, and the percentage of matches drawn is 27.43%.

3. England with 36.15%
From 1877 to 2022, England played 1051 matches, won 380, and lost 316, in which 0 were tied, and 354 were drawn matches. The win/loss ratio is 1.20, the percentage of winning matches is 36.15%, the percentage of losing matches is 30.06%, and the percentage of matches drawn is 33.68%.

4. Pakistan with 32.65%
From 1952 to 2022, Pakistan played 444 matches, won 145, and lost 135, in which 0 were tied and 164 were drawn matches. The win/loss ratio is 1.07, the percentage of winning matches is 32.65%, the percentage of losing matches is 30.4%, and the percentage of matches drawn is 36.93%.

5. West Indies with 31.85%
From 1928 to 2022, West Indies played 565 matches, won 180, and lost 204, in which 1 was tied and 179 were drawn matches. The win/loss ratio is 0.88, the percentage of winning matches is 31.85%, the percentage of losing matches is 36.1%, and the percentage of matches drawn is 31.68%.

6. Sri Lanka with 31.68%
From 1982 to 2022, Sri Lanka played 303 matches, won 96, and lost 115, in which 0 were tied, and 92 were drawn matches. The win/loss ratio is 0.83, the percentage of winning matches is 31.68%, the percentage of losing matches is 37.95%, and the percentage of matches drawn is 30.36%.

7. India with 29.89%
From 1932 to 2022, India played 562 matches, won 168, and lost 173, in which 1 was tied, and 220 were drawn matches. The win/loss ratio is 0.97, the percentage of winning matches is 29.89%, the percentage of losing matches is 30.78%, and the percentage of matches drawn is 39.14%.

8. New Zealand with 23.79%
From 1930 to 2022, New Zealand played 458 matches, won 109, and lost 180, in which 0 was tied, and 168 were drawn matches. The win/loss ratio is 0.60, the percentage of winning matches is 23.79%, the percentage of losing matches is 39.3%, and the percentage of matches drawn is 36.68%.

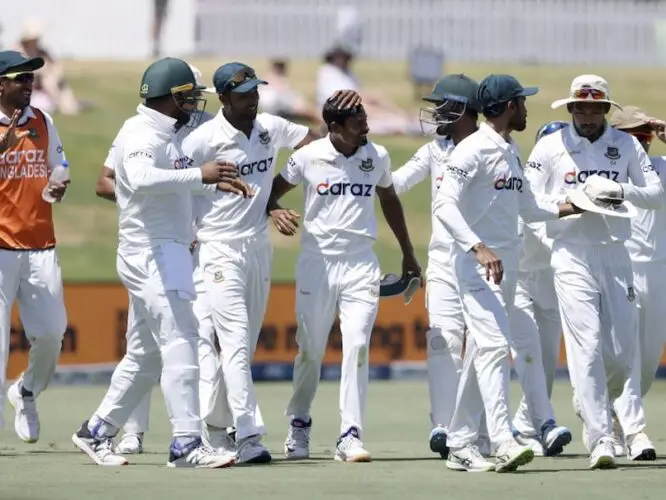
9. Bangladesh with 11.94%
From 2000 to 2022, Bangladesh played 134 matches, won 16, and lost 99, in which 0 was tied, and 18 were drawn matches. The win/loss ratio is 0.16, the percentage of winning matches is 11.94%, the percentage of losing matches is 73.88%, and the percentage of matches drawn is 13.43%.
10. Zimbabwe with 11.3%
From 1992 to 2021, Zimbabwe played 115 matches, won 13, and lost 74, in which 0 were tied and 28 were drawn matches. The win/loss ratio is 0.17, the percentage of winning matches is 11.3%, the percentage of losing matches is 64.34%, and the percentage of matches drawn is 24.34%.